From -7.
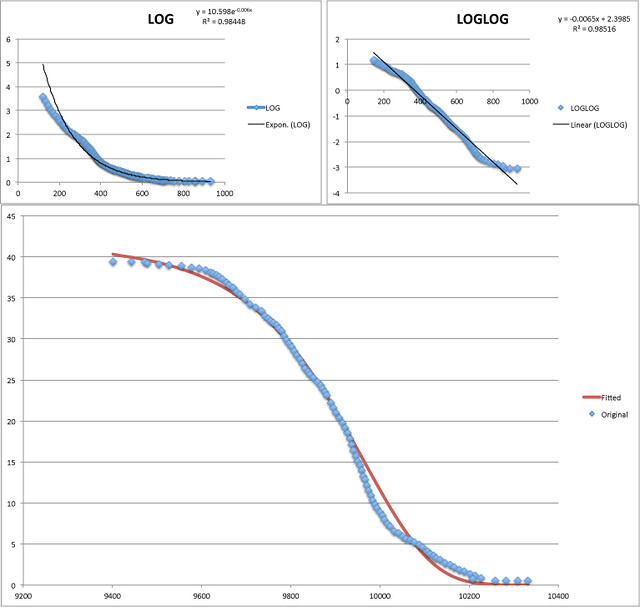
Eyeball transformations and fit to exp(exp) format of the right edge of the proton pulse from Extraction 1 in the OPERA paper.
Having the analytical form enables me to verify that the maximum likelihood computation used by OPERA is sensitive to the edges of the pulse. I do not understand their standard error computation (not that it is wrong; I just don't understand it.) I also think that perhaps the Kolmogorov-Smirnov test would have been a better tool for estimating the delay. If I get my hands on Mathematica in the next few days, maybe I can do something.
Here is a reconstruction of the proton pulse (blue line; without the features on the plateau) and the neutrinos events at the edges (orangish squares). Also the events flipped (green triangles). The time scale is nanoseconds.
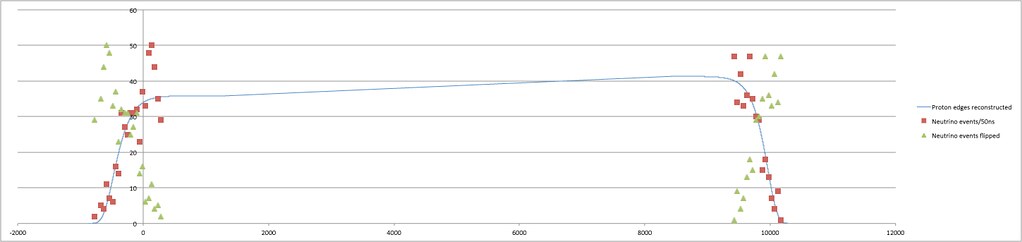
It seems that the flipped events fit with a similar standard error as the original ones (σ = 8-10ns).
Let me try to explain.
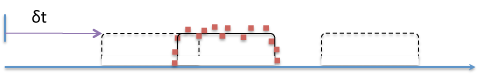
This depicts (orange dots) a histogram of the neutrino events detected at various points in time. The black square curve represents the proton pulse. You slide it around to get a "best fit" to the neutrino events, and the amount you need to slide it is the estimated time delay (that turns out to be 60ns too small).
Eyeball transformations and fit to exp(exp) format of the right edge of the proton pulse from Extraction 1 in the OPERA paper.
Having the analytical form enables me to verify that the maximum likelihood computation used by OPERA is sensitive to the edges of the pulse. I do not understand their standard error computation (not that it is wrong; I just don't understand it.) I also think that perhaps the Kolmogorov-Smirnov test would have been a better tool for estimating the delay. If I get my hands on Mathematica in the next few days, maybe I can do something.
Here is a reconstruction of the proton pulse (blue line; without the features on the plateau) and the neutrinos events at the edges (orangish squares). Also the events flipped (green triangles). The time scale is nanoseconds.
It seems that the flipped events fit with a similar standard error as the original ones (σ = 8-10ns).
Let me try to explain.
This depicts (orange dots) a histogram of the neutrino events detected at various points in time. The black square curve represents the proton pulse. You slide it around to get a "best fit" to the neutrino events, and the amount you need to slide it is the estimated time delay (that turns out to be 60ns too small).
Let's call the proton curve W(t). Then OPERA computes:
P(δt) = Product( W(ti + δt) ), where ti are the neutrino arrival times. The neutrino events are rather sparse, less than 1 per nanosecond; the proton pulse is composed of billions of protons per nanosecond. So we're not curve-fitting here; we're computing a probability of this sequence of events taking place, assuming that it is perfectly proportional to the proton pulse.
In the three positions of W depicted, from left to right, P is somewhat positive, P is at its maximum, and P is zero. If you examine how P reaches its maximum as you slide W along, the graph below (the y-axis scale arbitrarily chosen) depicts it - it is a Gaussian with σ ~ 8ns - (which is where from the standard error estimate comes from, I believe.)
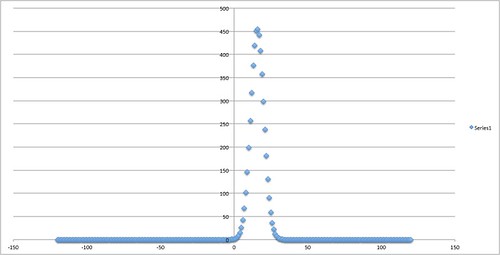
With the data that I have, I find adding or removing just one neutrino event from the edge shifts the maximum by 5-6ns.
I also find that the maximum is just as sharp for the green triangles from the diagram above as for the orange squares. P(δt) cares really about edge data, and the leading and trailing edges have sparse statistics. That is why I think Kolmogorov-Smirnov which compares cumulative probability distribution functions and is not so sensitive to details of the edges would be a better estimator.
The edge sensitivity is easy to see; for small δt
ln(P(δt)) = Σ ln ( W(ti + δt))
(using Wi for W(ti))
= Σ ln(Wi) + δt Σ W'i/Wi + 1/2 δt2 Σ ( W"i/Wi - (W'i/Wi)2
What contributes to the variation in P are the regions where W'/W and W"/W are significant, which are the edges.