This is from 2011, talking about the "next generation sequencing". I'm told newer technology is on the way, but still not in wide use, so this is still relevant.
http://www.ncbi.nlm.nih.gov/pmc/articles/PMC3593722/
Genotype and SNP calling from next-generation sequencing datahttp://www.ncbi.nlm.nih.gov/pmc/articles/PMC3593722/
Meaningful analysis of next-generation sequencing (NGS) data, which are produced extensively by genetics and genomics studies, relies crucially on the accurate calling of SNPs and genotypes. Recently developed statistical methods both improve and quantify the considerable uncertainty associated with genotype calling, and will especially benefit the growing number of studies using low- to medium-coverage data. We review these methods and provide a guide for their use in NGS studies.
This next one is intriguing too. Frankly, I would not have guessed that laboratory conditions, reagent lots and personnel differences might lead to large problems.
http://www.nature.com/nrg/journal/v11/n10/full/nrg2825.html
Tackling the widespread and critical impact of batch effects in high-throughput data
High-throughput technologies are widely used, for example to assay genetic variants, gene and protein expression, and epigenetic modifications. One often overlooked complication with such studies is batch effects, which occur because measurements are affected by laboratory conditions, reagent lots and personnel differences. This becomes a major problem when batch effects are correlated with an outcome of interest and lead to incorrect conclusions. Using both published studies and our own analyses, we argue that batch effects (as well as other technical and biological artefacts) are widespread and critical to address. We review experimental and computational approaches for doing so.
---
The next one is a personal observation, possibly of little merit. All these studies that try to figure out the ancestry of populations essentially compile some data, apply some statistical models and computation and then try to come to some conclusions. One way of looking at it is that they trying to create classifiers, trees or directed graphs with some level of statistical reliability. But another way of looking at it is that they are doing one-half of machine learning. They have created a training set and applied it. The second part, which is to use the model to make predictions is missing. That is, having done their first thousand samples, they should now let their trained model work on the next thousand samples, and see how well it performs. IMO, this would be as good a demonstration of the statistical significance of their model as any other.
---
PS:
http://biorxiv.org/content/biorxiv/early/2016/06/15/059139.full.pdf
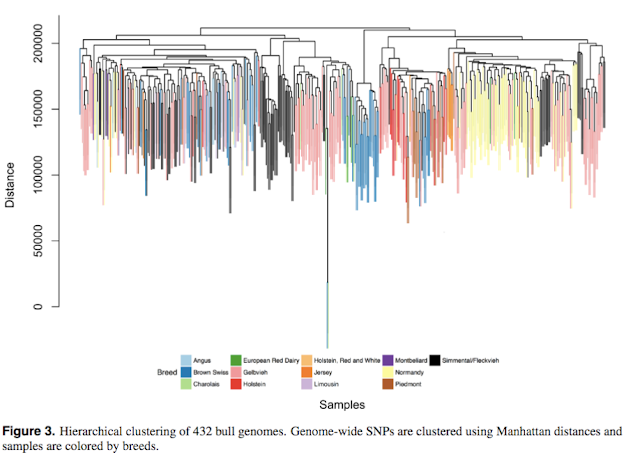
Among these genomes, there are m = 3,967,995 single nucleotide polymorphisms (SNPs) with no missing values and minor allele frequencies ¿ 0.05 (Supplementary Fig. 2). To explore structural complexity, whole genome sequences of n = 432 selected samples were hierarchically clustered using Manhattan distances (Figure 3, colored by 13 different breeds). It is evident that official breed codes (or countries of origin) do not necessarily represent the genetic diversity among bulls represented by SNPs.
